
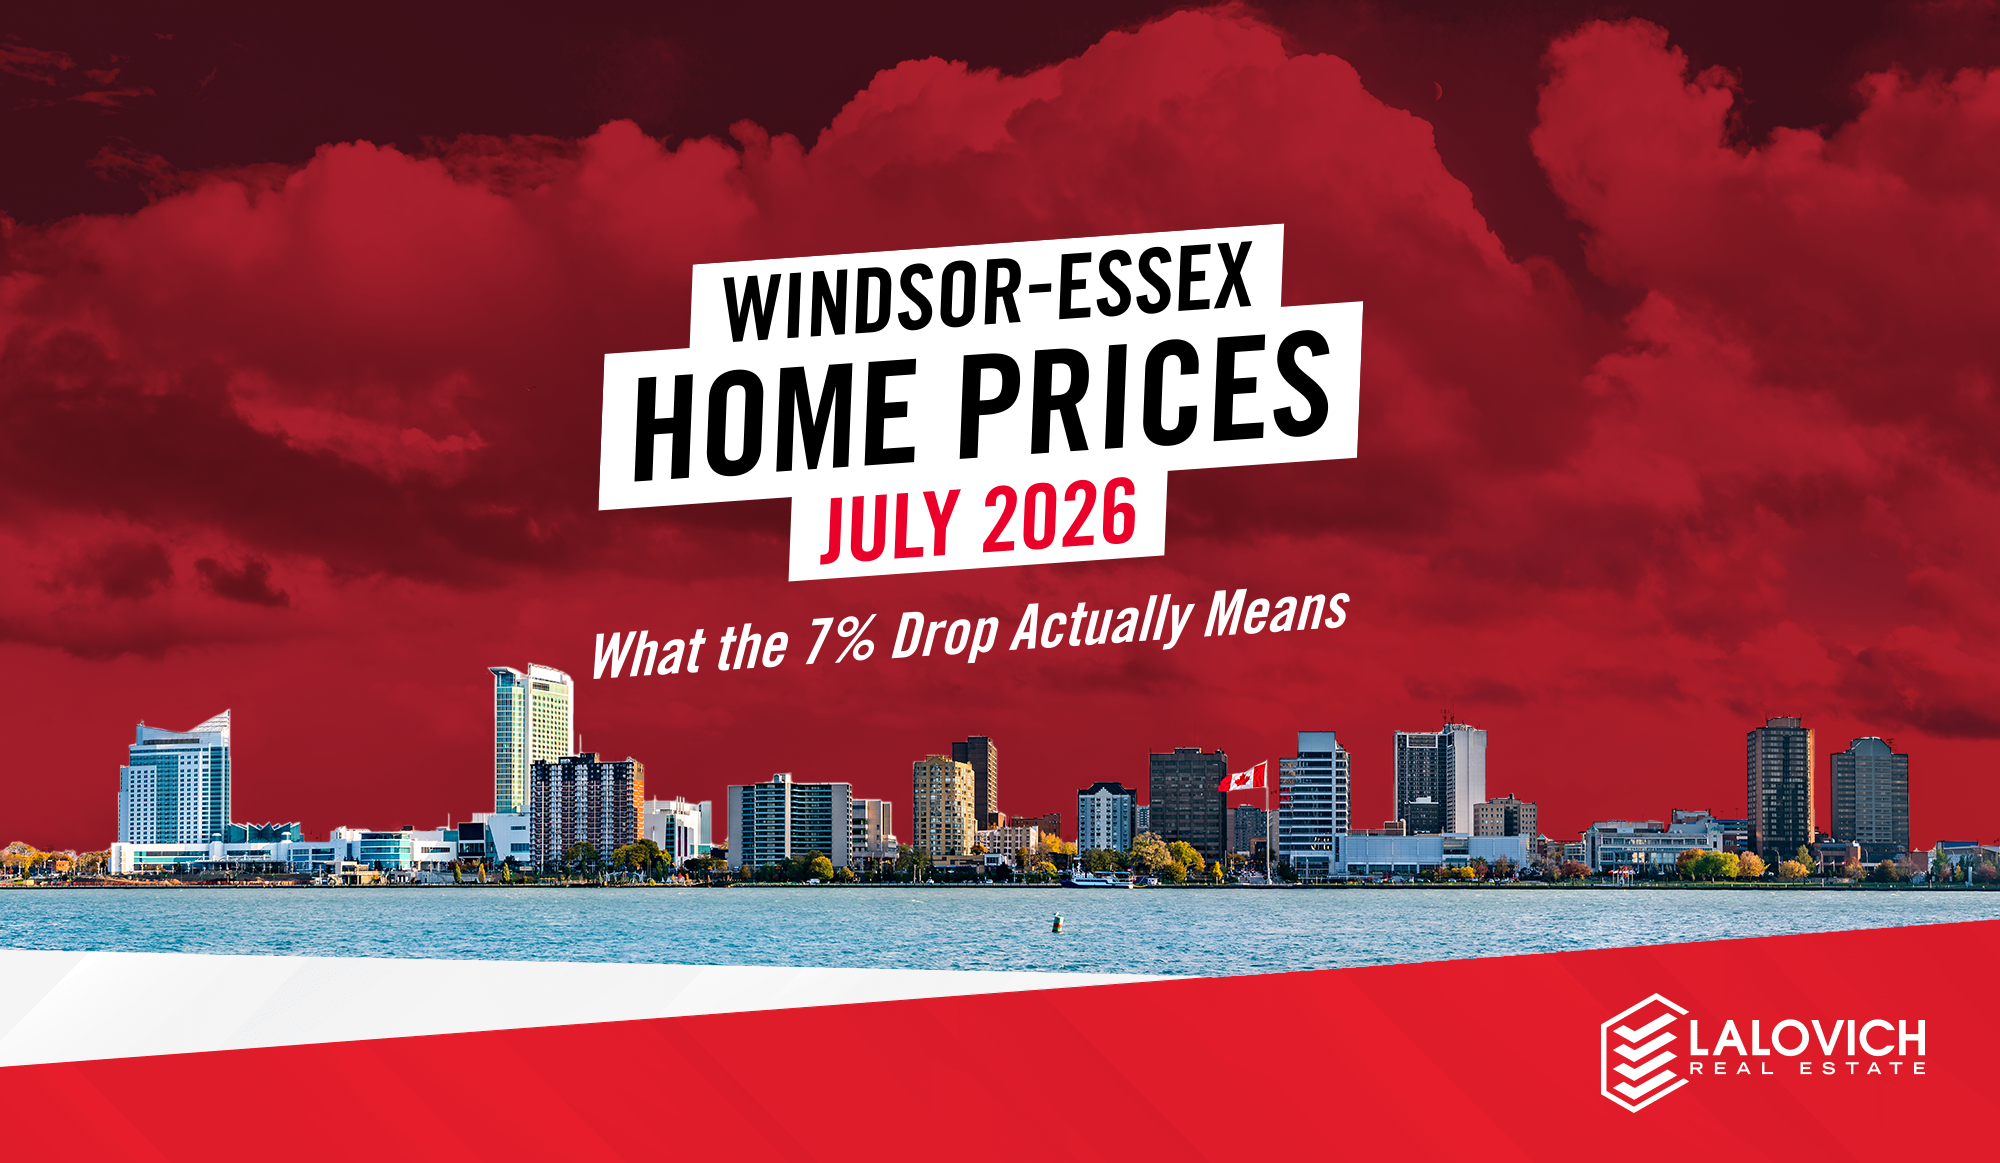
Windsor-Essex Home Prices July 2026: What the 7% Drop Actually Means
Posted on August 12th 2026 by Lalovich
You may have seen the headline. Home prices in Windsor-Essex dropped 7 percent last month.
If you own a home here, that number probably made you uncomfortable. If you are trying to buy one, it may have made you want to wait a little longer.
Before you do either, it is worth understanding what that 7 percent actually measures. Because your home almost certainly did not lose 7 percent of its value in July.
Two Ways to Measure a Market
There are two price numbers in every monthly report, and they told very different stories in July.
The first is the average sale price. You take every home that sold and divide the total by the number of sales. In July that came to $541,019, which is 7 percent lower than last July.
The second is the benchmark price. Instead of averaging whatever sold, it tracks the same house every single month. Three bedrooms, two bathrooms, about 1,400 square feet, single garage, built in the late nineties. A typical Windsor-Essex home. In July that home was worth $579,100, which is slightly higher than a year ago.
One number says the market fell. The other says it held steady. Both are correct.
Think of it Like a Grocery Bill
Say you normally fill your cart with name brand groceries. One month money is tight, so you buy more no-name products.
Your average cost per item drops.
Did grocery prices fall? No. You just bought different things.
That is what happened in Windsor-Essex in July. More affordable homes made up a bigger share of the sales. Bungalows led the month with 126 sales at an average of $480,130, well under the county average. When cheaper homes make up more of the mix, the average falls even though no individual home lost value.
So the 7 percent tells you what buyers spent last month. It does not tell you what your house is worth.
What Actually Happened in July
| July 2026 | Change from last July | |
|---|---|---|
| Homes sold | 522 | down 7.8% |
| Average sale price | $541,019 | down 7.0% |
| Benchmark price (same home each month) | $579,100 | up 0.9% |
| Homes for sale | 2,307 | up 3.5% |
| New listings | 1,390 | down 6.6% |
| Sold at this % of asking price | 100.1% | was 102.6% |
| Half of homes sold within | 21 days | was 19 days |
That second-last row is the honest summary of where we are. A year ago the typical home sold for slightly more than asking. Today it sells for right about asking. Bidding wars are gone. Fire sales have not arrived. This is what a normal market looks like, and most of us have not seen one in a while.
Fewer People are Listing than you Might Think
Here is the part almost nobody is talking about.
In July, 1,390 homes came on the market in Windsor-Essex. That is 6.6 percent fewer than last July.
Yet the total number of homes for sale still went up, to 2,307.
Both things happened at once, which tells you something specific. Sellers did not flood the market. There are simply more homes sitting because fewer buyers are moving.
That is a meaningful difference. Earlier this year, inventory was climbing because new listings kept pouring in. In July, it climbed because sales slowed down. If you have been holding off on listing because you assumed you would be competing with everyone else, the data does not really support that worry right now.
We would not call this a turning point yet. One month is one month, and listings usually jump after Labour Day. But it is the first month this year where the supply picture moved in a seller’s favour.
Not Every Part of the County is the Same
The county-wide number hides a lot. “Months of inventory” below simply means how long it would take to sell everything currently listed at the current pace. Under four months favours sellers. Over six favours buyers.
| Area | Months of inventory | Who has the advantage |
|---|---|---|
| Forest Glade / Fountainbleu | 2.4 | Sellers, clearly |
| Central Windsor / Downtown | 2.7 | Sellers |
| East Windsor | 4.2 | Balanced |
| Tecumseh | 4.8 | Balanced |
| LaSalle | 5.0 | Slight edge to buyers |
| West Windsor | 7.4 | Buyers, clearly |
Forest Glade and Fountainbleu is the tightest area in the county right now, with fewer homes listed there than a year ago. West Windsor is the softest, with prices down meaningfully. Tecumseh saw sales drop by half, but prices there actually held.
By property type, condos and apartments are the one segment where values genuinely fell, down about 6 percent over the past year. Townhouses are the strange one: almost nothing is selling, yet prices have not moved. Buyers and sellers are at a standoff, and standoffs eventually break one way or the other.
If someone tells you “the Windsor market is down,” ask them which part. It matters a lot.
So What Should You do?
If you are thinking about buying, you have more room than you did two years ago, but less than the headlines suggest. You have time to look properly, get an inspection, and think it over. You are unlikely to get a big discount just for showing up. Look hardest at condos, townhouses and West Windsor, where sellers have the least leverage.
If you are thinking about selling, price to what your specific home and neighbourhood are actually doing, not to a county-wide average that is being dragged around by what happened to sell. And know that your competition is thinner than the headlines imply.
If you are just wondering whether your house is still worth what you thought, it very likely is. The measure built to answer that question says values are roughly flat year over year.
Questions We get Asked
Did home prices in Windsor-Essex really drop 7 percent? The average sale price dropped 7 percent, but that reflects a shift toward more affordable homes selling, not a loss of value. The benchmark price, which measures the same home each month, is up slightly from last year.
Is now a good time to buy in Windsor-Essex? Conditions are more balanced than they have been in years. Homes are selling at about asking price and taking around three weeks. You have negotiating room and time to do proper due diligence, which was not the case in 2021.
Should I wait for prices to fall further? The data does not point clearly in either direction. Values have been roughly flat, fewer homes are being listed, and sales have slowed. Waiting has a cost too, particularly if interest rates move. The better question is usually whether the move makes sense for your situation, not whether you can time the bottom.
Want to know what your specific street or building is doing? Reach out and we will pull the numbers for you. It takes about ten minutes and there is nothing attached to it.
We publish this breakdown every month using the raw data from the Windsor-Essex County Association of REALTORS and CREA.
Data source: CREA and WECAR, Windsor-Essex County Residential Market Activity and MLS Home Price Index Report, July 2026.
Share: Share on facebook Send it with e-mail Share on twitter Share on linkedin